Temperature Life Stories: Feeling the Heat
What causes us to experience temperatures differently? The impacts of climate change will be widespread but will not be felt equally. This research seeks to facilitate an exploration of human experience of rising temperatures.

Global temperatures are changing: the impacts of these changes will be widespread but will not be felt equally. Despite its ‘temperate’ climate, the UK regularly experiences summer heatwaves capable of causing discomfort, health impacts and even mortality. How exposure to weather and socioeconomic factors affect an individual’s lived experience in response to climate change is a huge unknown. What causes temperatures to be too extreme for one person but not another? How do our memories affect our perception of risk? How do we as individuals experience a changing climate through the cultural life of weather?
What did the project involve?
By adopting a ‘practice-as-research’ model of arts-related research, Temperature Life Stories explored these questions with two underlying aims:
- To facilitate personal exploration of human experiences of climate change with the non-human (weather, climate, heatwaves and ecological surroundings), building connection and understanding of each other’s environmental lives.
- To inform climate impacts science of the breadth, movement, and idiosyncrasies of human experience of temperature, particularly important in the build-up to the 26th UN Climate Change Conference (COP26) in November 2021.
Both of these top-down and bottom-up approaches were required to reduce the negative impacts of climate change to wellbeing.
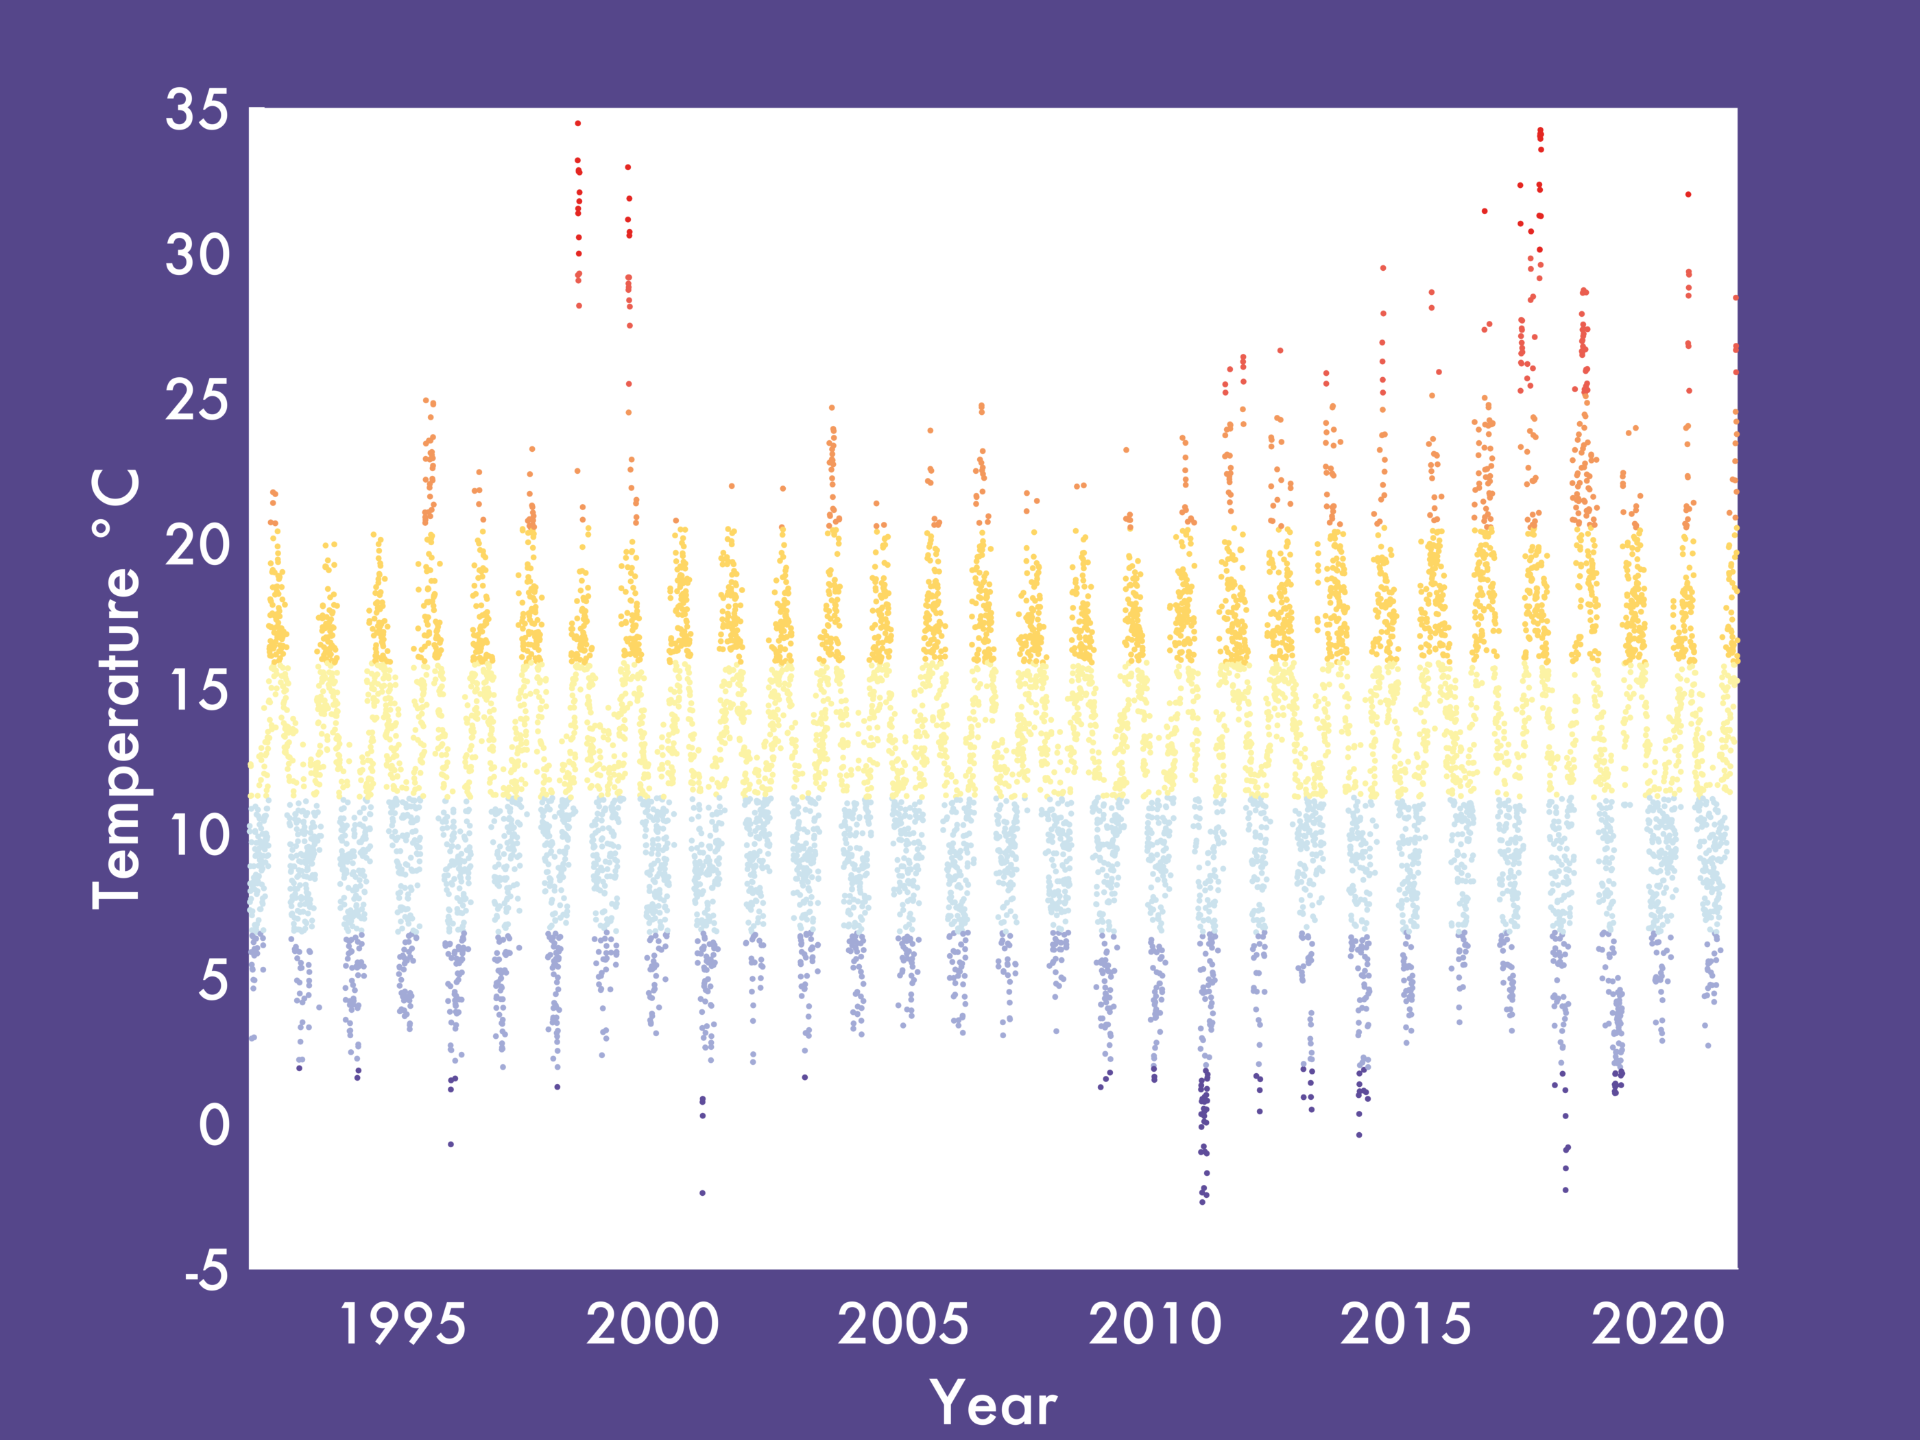
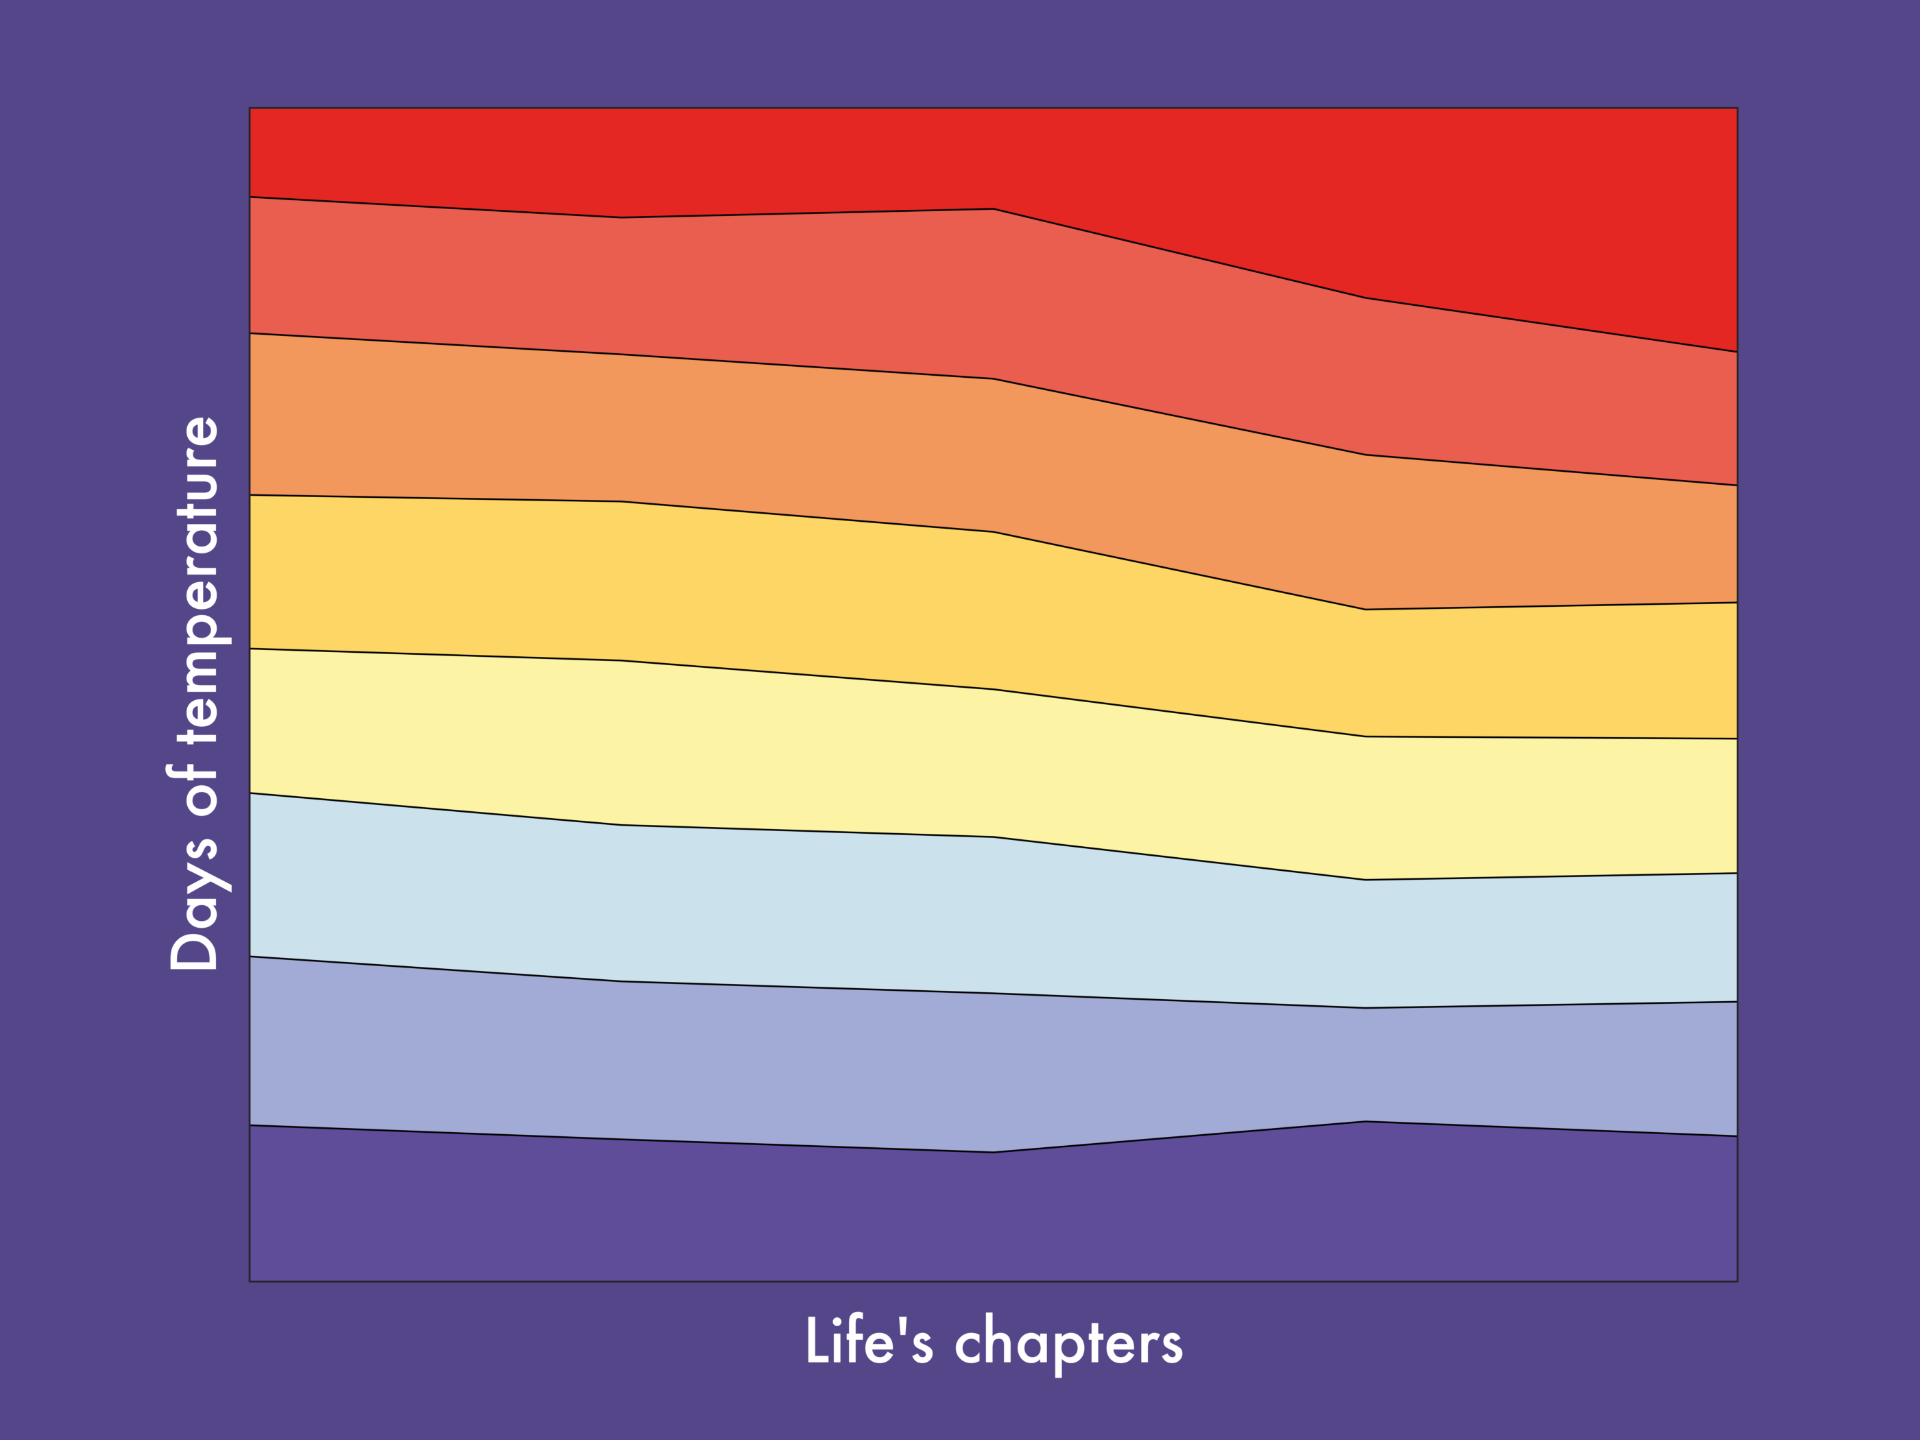
A schedule of blended virtual and in-person creative workshops were carried out with community groups within Bristol. At the workshops, participants used poetry to explore and reflect on subjective questions such as ‘how hot do I feel today?’, ‘when was the last time I felt too hot?’ and ‘what was the hottest day I remember?’ During the project, personalised temperature graphs were created for each participant using climate datasets to track the temperature experienced throughout their life, with all the variability of weather, seasons, movement and climate change. Together, they then explored and reflected on the crossover, interaction and contradiction between the poetry and graphs.
Who are the team and what do they bring?
- Alan Kennedy-Asser (Geographical sciences) is a climate scientist whose research focuses on changing heatwave frequency in the UK, with a current focus on human health impacts.
- Caleb Parkin (Bristol City Poet) has a wealth of experience in activities where poetry and group practice are a means of accessing research and a mode of inquiry themselves. He has an explicit interest in environmental issues in his role as Bristol City Poet.
- Clifton Evers’s (Newcastle University) research background includes wide-ranging experience in creative and participatory research methods, which have been applied to environmental topics such as pollution and blue spaces.
- Ellie Shipman’s (Artist and illustrator) past work has included making the invisible visible, for example an artwork on air pollution deaths, and has done research on participatory art and community climate resilience.
- Kirk Sides (English) specialises in African environmental literatures, his current work explores environmental and decolonial thinking in African literatures. He also runs workshops on science fiction, storytelling and climate change.
- Karen MacDonald (Bristol Museums) will assist in the outreach to community groups for participants and developing longer-term outcomes from the project.
- Cassandra Phoenix (Durham University) researches the connections between health, wellbeing and the environment by examining people’s engagement with and connection to “nature”, through projects such as Weathered Lives.
- Sarah Mountford (Windmill Hill City Farm) will assist with participant recruitment, exploring the intrinsic connection between horticulture and the weather
What were the results?
The workshops culminated in in a mixed media online exhibition coproduced and curated by participants in order to tell their temperature life stories.
The research team also produced an interactive online toolkit that included prompts for creative activities, questions to encourage inter-generational thinking and a simple app that allows a personalised temperature graph to be created by anyone around the world.
View the Temperature Life Stories online exhibition and toolkit on the Temperature Life Stories website
Hear from researchers in conversation about the research journey: Using arts-based research for temperature, weather and climate.
Find out what happened when Temperature Life stories went to COP26: Telling the story of temperature
A longer-term aim for the project is to feed into a Bristol Museums exhibition on the local impact and response to climate change in Bristol. The team will also be looking into further funding opportunities and to set up an academic and community advisory panel to help develop the projects impact further.