
MAPHIS: Using machine learning to understand city development
Contributed by the researchers of MAPHIS: Mapping History - What historical maps can tell us about urban development
Brigstow funded Experimental Partnership “MAPHIS: Mapping History – What historical maps can tell us about urban development” intends to develop novel, interdisciplinary methods that facilitate the extraction of information from historical maps and the analysis of Census records, in order to study urban development in the long run.
The blessing, the curse, and the distortion of time.
For researchers interested in economic history, there are lengthy periods during which isolation is welcomed, or even required. In isolation, the economic historian can freely explore new data sources, discover hidden gems, and encounter issues—more often the latter of these three. In that regard, lockdown was first a blessing, then a curse. Time was in infinite supply, then suddenly lacking.
The blessing
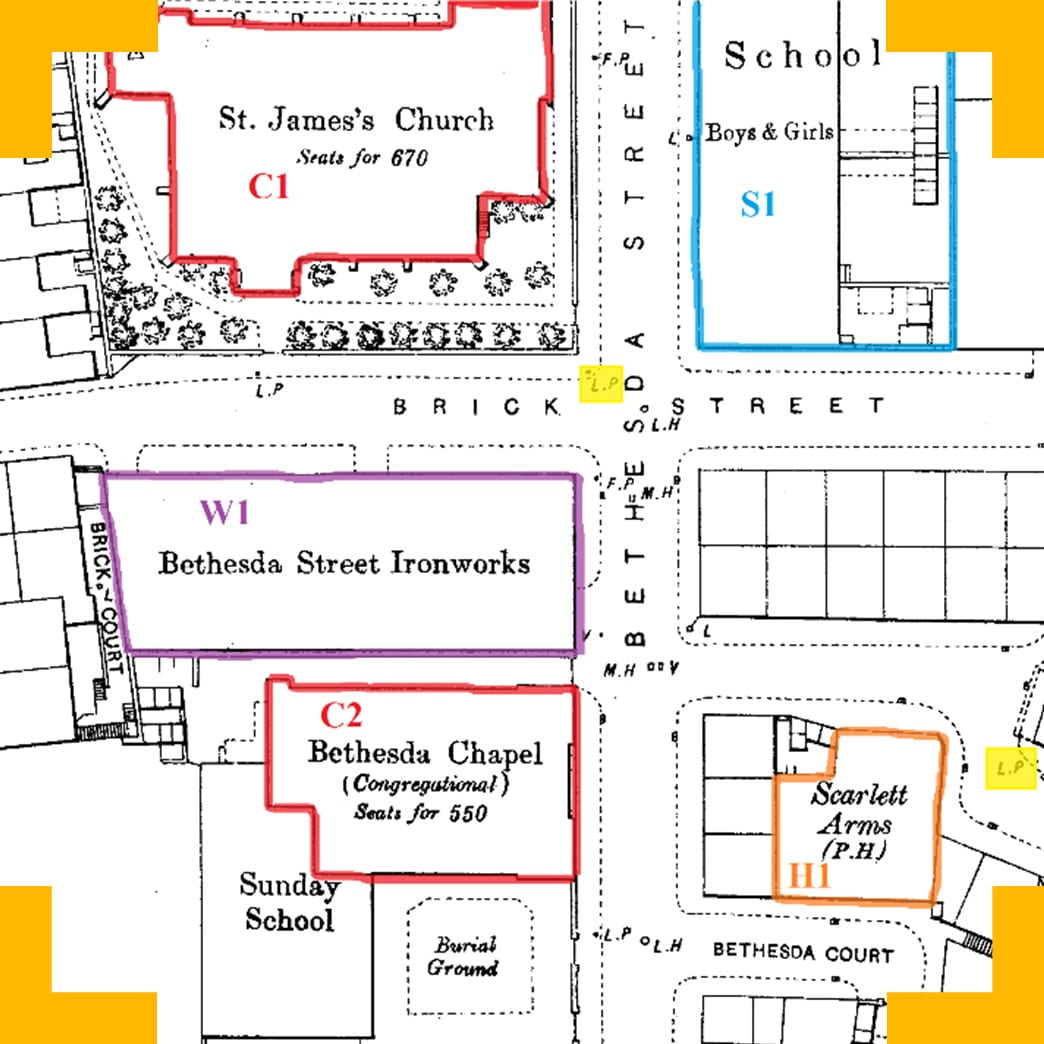
The MAPHIS project relies on access to invaluable data sources: the universe of Census records between 1851 and 1911; Ordnance Survey maps 1870-1940. Census surveyors and cartographers (also) had time on their hands; lockdown was the opportunity to discover and exploit the consistent reporting of industrial chimneys by cartographers (see the red circle below) and the consistent reporting of farming activity by Census surveyors (notably the number of acres for each land owner) between 1851 and 1881.
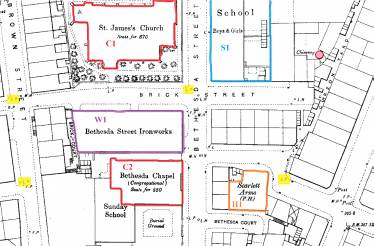
Industrial chimneys are a salient feature of the rising industrial city, while the structure of farmland ownership is important to understand migration from its hinterland into the growing city. The lockdown was the perfect opportunity to try and extract these novel bits of information.
The curse
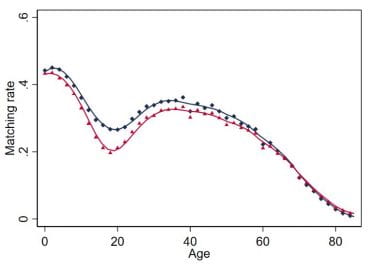
Working with historical data is, however, challenging. For instance, maps are repositories of unorganised data: text, symbols, lines/segments, and coloured surfaces are often grouped together on the same map tile, each corresponding to different pieces of information. Even Census records lack the structure of a dataset: data structuring has lately been disciplined by the availability of, and need for, computer-based operations (e.g. the merge between datasets along a set of identifying variables); historical data sources thus often lack this inherent structure. Understanding rural-urban migration requires matching individuals across Census waves, based on their names, family structure etc., leading to low matching rates (see below for 1851-1861 for 17,000,000 individuals across England and Wales).
The distortion of time
Time initially appeared to be in infinite supply. There were discoveries, then issues, and more issues. Time was then suddenly lacking. We hope that the next blog entry will discuss the output of research, more specifically:
- how the grain invasion led to a massive rural-urban migration from rural hinterlands to cities,
- how residential sorting of migrants shaped the city,
- and how industries and their environmental impact further reinforced neighbourhood segregation.
View the MAPHIS project page or hear about the research progress to date on youtube: Mapping, Data and Interdisciplinary.